Journal: bioRxiv
Article Title: Competition between stochastic neuropeptide signals calibrates the rate of satiation
doi: 10.1101/2023.07.11.548551
Figure Lengend Snippet: (A) To measure potential axon excitability differences across states, which could lead to differences in peptide release, we first co-expressed Chrimson and Axon-GCaMP6s in AgRP neurons and, in separate experiments, in POMC neurons. In both cases, we implanted an optic fiber in PVH to photostimulate Chrimson-expressing axons and to record the resulting calcium transients in these same axons. Axon calcium transients evoked by 25-Hz, 8-s Chrimson stimulation in AgRP (left) and POMC axons (right) were similar in fasted and fed states (n = 9 mice). (B) Brief 10 Hz, 1 s Chrimson stimulation of AgRP axons triggers stronger calcium transients in the fed state (when NPY signaling is weaker). The same photostimulation of POMC axons triggers stronger calcium transients in the fasted state (when αMSH signaling is weaker). These differences are presumably due to lower baseline activity of AgRP axons and POMC axons in the fed and fasted state, respectively. n = 9 mice. Note that these differences argue against a major contribution of presynaptic excitability to the state-dependent differences in cAMP responses: AgRP stimulation drives weaker PVH MC4R cAMP responses in the fed state, despite the slightly stronger 1-s stimulation-evoked AgRP axon calcium signals in the fed state. Similarly, POMC stimulation drives weaker PVH MC4R cAMP responses in the fasted state, despite the slightly stronger 1-s stimulation-evoked POMC axon calcium signals in the fasted state. (C-D) We used blue-light activation of the optogenetic adenylyl cyclase, biPAC, to bypass endogenous peptide receptor signaling and directly produce cAMP in PVH MC4R neurons in slices, while monitoring cAMP dynamics with the sensor cADDis. cAMP produced by biPAC photostimulation (1x 100 ms or 2x 2 s) in PVH MC4R neurons is cleared by endogenous PDEs at similar rates in fasted and fed states, arguing against state-dependent cAMP degradation (n = 8 slices from 4 mice). (D) MTII injection (3 mg/kg, i.p.) elevates cAMP in PVH MC4R neurons using two-photon fluorescence lifetime imaging in vivo (n = 6 FOVs from 3 mice, one-way ANOVA). (E) MTII pre-injection does not change the hit rate of AgRP stimulation–induced cAMP decrements (n = 473-517 trials from 3 mice). (F-G) αMSH pre-injection does not change the hit rate of AgRP stimulation–induced cAMP decrements (F) but reduces hit magnitudes (G). n = 391-473 trials from 2 mice, bootstrap comparison of hit rates. (H-I) NPY pre-infusion does not change the hit rate of POMC stimulation–induced cAMP increments (H) but reduces hit magnitudes (I). n = 1311-1667 trials from 2 mice, bootstrap comparison of hit rates. (J-L) When analyzing two consecutive hits of AgRP stimulation–induced cAMP decrements, the second decrement is larger than the first (n = 13 FOVs from 4 mice). Amplitudes are calculated as –ΔF/F 0 means in the 20-40 s window following stimulation onset. Baselines are calculated separately for first and second hits to prevent lingering elevation from the first hit from contributing to the calculations of the second. (M-O) The same as J-L but for POMC stimulation–induced cAMP increments (n = 10 FOVs from 4 mice). (P-Q) To more directly manipulate the total amount of peptide released in a local region of PVH, we presented groups of ten 8-s photostimulations of AgRP and POMC axons with a much shorter inter-stimulation interval (2 s instead of 52 s; other experimental parameters were not modified). The shorter inter-stimulation intervals within each 98-s stimulation sequence should decrease the degree to which peptides released during each 8-s stimulation diffuse away or are broken down by peptidases (Xiong et al ., 2022; Turner et al ., 1985) between trials, resulting in greater accumulation of extracellular neuropeptide levels that could overcome endogenous competition from opposing neuropeptides (illustrated in P). Consistent with this prediction, these 98-s groups of AgRP or POMC axon stimulations drove cAMP decrements (P; 42-44% hit rate per group) and increments (Q; 45-48% hit rate) that were long-lasting (>8 min after the last pulse) and insensitive to hunger state. P: n = 112-167 trials from 4 mice, Q: n = 97-139 trials from 4 mice.
Article Snippet: For experiments that measure the impact of simultaneous POMC neuron activation and AgRP neuron inhibition on feeding, AAV8-hSyn-DIO-hM4D(Gi)-mCherry (Addgene 44362-AAV8) and AAV8-FREX-ChR2-EYFP (gift from Henning Fenselau) were injected bilaterally in the arcuate nucleus of AgRP-IRES-Cre;POMC-Dre mice (1:1 mixture, 150 nl total; Bregma: AP -1.5 mm, ML ±0.3 mm, DV -5.9 to -5.75 mm).
Techniques: Expressing, Activity Assay, Activation Assay, Produced, Injection, Fluorescence, Imaging, In Vivo, Comparison, Modification, Sequencing
![FIGURE 3 Fam163a knockdown and rotenone reduce the firing rate of ARCAgRP neurons. (A and D) Representative immunostaining against FAM163A. White arrows depict the co-expression of GFP and FAM163A (Scale bars: [A and C] 50 μm and [B and D] 20 μm). (E) GFP expression in <t>AgRP</t> <t>neurons</t> containing brain slice of AgRP-Cre mouse. (Representative image depicting Cell-attached loose-seal recording from an AgRP neuron; recording pipette is highlighted with red-dashed lines, Scale bar: 15 μm). (F and H) Representative loose- seal recording traces for each group. (G) Effect of Fam163a KD on firing rate of AgRP neurons (n = 3–4 mice for each group; Neg. Ctr. n = 70 neurons, Fam163a KD n = 63 neurons) (I) Effect of rotenone on firing rate of AgRP neurons (n = 3–4 mice for each group; DMSO n = 46 neurons, rotenoe n = 52 neurons) (Data are mean ± standard deviation. Statistical analysis: Mann–Whitney U test; *p = 0.017; **p = 0.0062).](https://pub-med-unpaywalled-images-cdn.bioz.com/pub_med_ids_ending_with_1489/pm40071489/pm40071489__page6_image1.jpg)
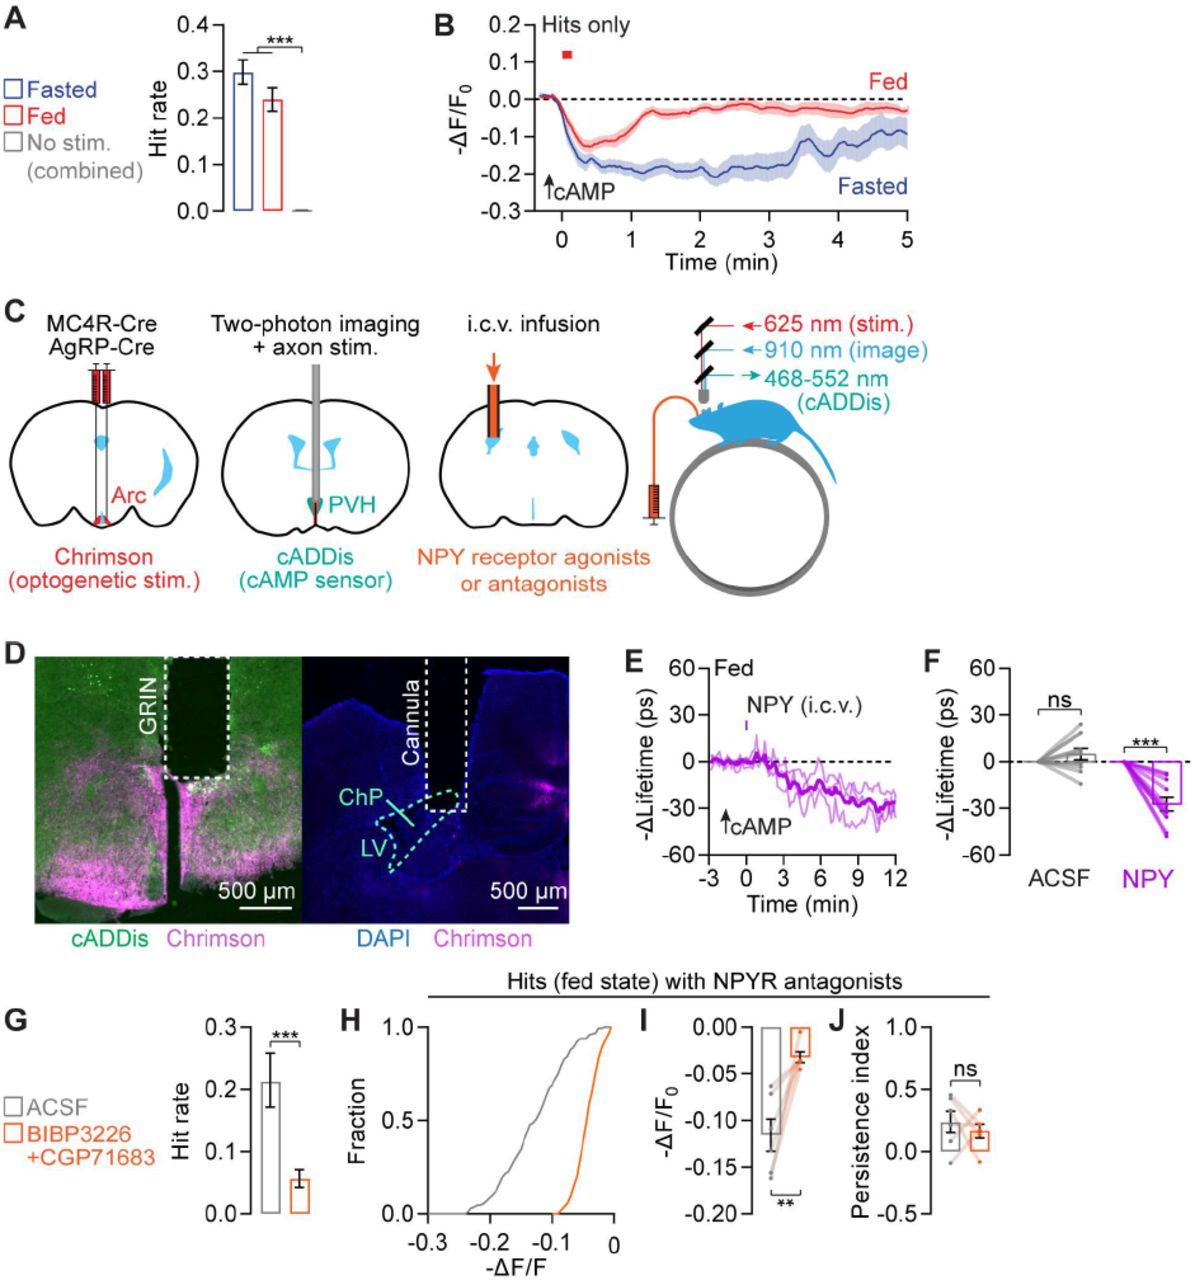
![(A) Model: <t>AgRP</t> axon stimulation could decrease cAMP production by releasing neuropeptide NPY that binds to NPY receptors and/or by releasing AgRP that prevents MC4R receptor agonism. (B) Setup for optogenetic Chrimson stimulation of AgRP axons in the PVH in awake, head-fixed mice while measuring cAMP activity in PVH MC4R neurons using the sensor cADDis via a GRIN lens. (C) Example cAMP traces during 10 trials of photostimulation (8 s, 30 Hz, 60 s inter-trial interval; red shade) from a fed session show cAMP decrements (blue traces) that occurred on different trials for different cells. Traces show –ΔF/F 0 . (D) Summary plot of single-trial cADDis traces across cells shows an all-or-none distribution. Traces are sorted by peak fluorescence decrements in the 20-40 s window. Inset shows distribution of peak intensities, color-coded blue for hits and gray for misses, with the x-axis on a log scale. n = 2283 trials from 4 mice. (E) Odds of obtaining 2-4 hits (decrements) in a row are well modeled by the dice model (P n = [P 1 ] n ). n = 1190 fasted and 1093 fed trials from 4 mice. (F-G) In all trials (F) and in hit trials only (G), cAMP decrements are greater in amplitude and more persistent in the fasted state (n = 1190 fasted and 1093 fed trials from 4 mice). No-stimulation control trials show almost no hits. (H-I) cAMP decrements show greater amplitude (H) and persistence (I) in fasted than in fed mice (n = 13 FOVs from 4 mice, paired t-test). (J-K) I.c.v. pre-infusion of 10 nmol BIBP3226 (NPY1R antagonist) and 10 nmol CGP71683 (NPY5R antagonist) reduced both the hit rate (J) and amplitude (K) of cAMP decrements in fed mice. n = 680 ACSF and 909 antagonist trials from 2 mice. (L) Model: NPY release from AgRP axons and αMSH release from POMC axons respectively trigger stochastic and state-dependent cAMP increments and decrements in PVH MC4R neurons.](https://bio-rxiv-images-cdn.bioz.com/dois_ending_with_51/10__1101_slash_2023__07__11__548551/10__1101_slash_2023__07__11__548551___F3.large.jpg)